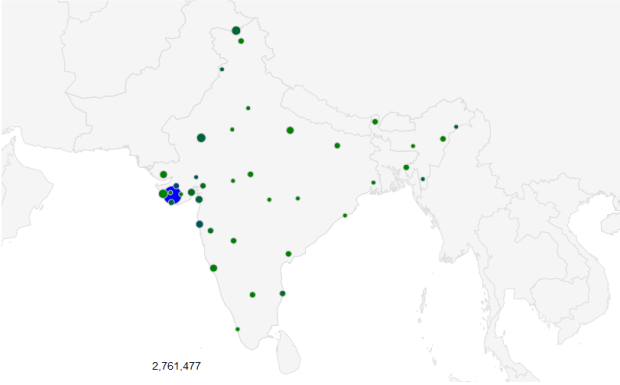
Display Location on map with Population


For Display any kind of data or product in selected city with country then you can use below code

 <script type='text/javascript' src='https://www.google.com/jsapi'>
 </script>
 
 <script type='text/javascript'>
 
 google.load('visualization', '1', {'packages': ['geochart']});
 
 google.setOnLoadCallback(drawMarkersMap);

 function drawMarkersMap() {
  var data = google.visualization.arrayToDataTable([
    ['City',       'Population', 'Area'],
    ['Junagadh',   2761477,      1285.31],
    ['Veraval',    761477,       85.31],
    ['Rajkot',     1324110,      81.76],
    ['Ahmedabad',  959574,       17.27],
    ['Mumbai',     907563,       130.17],
    ['Amreli',     97563,        31.17],
    ['Upleta',     9563,         32.17],
    ['Surat',      655875,       158.9],
    ['Porbandar',  07906,        243.60],
    ['Bhavnagar',  380181,       140.7],
    ['Baroda',     371282,       102.41],
    ['Goa',        67370,        213.44],
    ['Bhuj',       67370,        213.44],
    ['Delhi',      52192,        43.43],
    ['Pune',       348262,       110],
    ['Chennai',    382642,       101],
    ['Culcutta',   38622,        31],
    ['Banglore',   38262,        81],
    ['Patna',      81262,        71],
    ['Indore',     28262,        30],
    ['Bopal',      3262,         81],
    ['Kashmir',    322,          76],
    ['Cochin',     4321,         20],
    ['Jaipur',     4322,         30],
    ['Silong',     4323,         40],
    ['Agartala',   4324,         50],
    ['Nagaland',   4325,         60],
    ['Vijayvada',  32,           58],
    ['Sikkim',     22,           58],
    ['Puri',       35,           39],
    ['Raipur',     25,           29],
    ['Jodhpur',    607906,       243.60],
    ['Kargil',     607916,       246.60],
    ['Nagpur',     6,            26.60],
    ['Solapur',    60916,        46.60],
    ['Lucknow',    6916,         146.60],
    ['Amritsar',   696916,       16.60],
    ['changlang',  696916,       14.60],
    ['Lunglei',    496916,       19.60],
  ]);

  var options = {
    region: 'IN',
    displayMode: 'markers',
    colorAxis: {colors: ['green', 'blue']}
  };

  var chart = new google.visualization.GeoChart(document.getElementById('chart_div'));
  chart.draw(data, options);
 };
</script>


<div id="chart_div" style="width: 900px; height: 500px;"></div>

It will look like below image

Display Location on map with Population

Display Location on map with Population

*Note : Population data is a dummy data for testing purpose
Google Custom search


Create your code for google custom search from : http://www.google.com/cse

<p></p><form action="http://www.google.com/cse" id="cse-search-box">
  <div>
    <input type="hidden" name="cx" 
      value="002596005123405807971:h2ykeai42n0" />
    <input type="hidden" name="ie" value="UTF-8" />
    <input type="text" name="q" size="31" />
    <input type="submit" name="sa" value="Search in My Blog" />
  </div>
</form>
<script type="text/javascript" 
 src="http://www.google.com/coop/cse/brand?form=cse-search-box
    &lang=nl"></script>

OR

<script>
  (function() {
    var cx = '002596005123405807971:h2ykeai42n0';
    var gcse = document.createElement('script');
    gcse.type = 'text/javascript';
    gcse.async = true;
    gcse.src = (document.location.protocol == 'https:'
                   ? 'https:' : 'http:') +
        '//www.google.com/cse/cse.js?cx=' + cx;
    var s = document.getElementsByTagName('script')[0];
    s.parentNode.insertBefore(gcse, s);
  })();
</script>
<gcse:search></gcse:search>

Best Luck 🙂

If you have any query then feel free to contact me at Jainish Senjaliya